Staircase or linear scans: two options for reliable electrochemical experiments
Sep 27, 2021
Article
 Share via email
Electrochemical experiments are performed by delivering and controlling a potential or current signal to the electrochemical cell/device under test and measuring its response through a potentiostat/galvanostat (PGSTAT). Here, two different options for performing different electrochemical experiments are discussed: linear and staircase scans, as well as some applications where one may be preferred over another.
From analog to digital
Before modern digital electronics were widely available, PGSTATs worked with analog electronics, and therefore delivered analog signals. Analog boards were expensive and time-consuming to produce and test. Moreover, controlling the equipment from a computer is done via digital communication and requires digital electronics.
An analog signal is continuous, and it has virtually infinite resolution. On the other hand, a digital signal is written in discrete bits (0 and 1), so it is not continuous.

Linear scans
To better explain an analog signal, consider a linear sweep voltammetry (LSV) measurement in potentiostatic mode, performed with an analog scan. Here, the applied voltage E versus time plot consists of a straight line between the initial and end potentials. The potential interval between two consecutive data points and the scan rate define the interval time—the slope of the E versus time plot (Figure 1).

The current resulting from the application of the LSV is measured at the end of the interval time. The measurement time defines the duration of the sampling. The current is composed of a capacitive part ic (given by the charging of the double layer), and a faradaic part if.
A double layer is formed when a potential is applied to an electrode. Then, current flows to the electrode, which becomes charged. Ions from the bulk solution migrate to the surface to balance this charge. Therefore, a layer of ions at the interface between the electrode and the electrolyte builds up, forming the equivalent of a capacitor.
Learn more about the principles and characterization of capacitors in our free Application Note.
Supercapacitors: Principles and characterization using Autolab
The faradaic current is the result of the electrochemical reactions occurring at the working electrode | electrode and counter electrode | electrolyte interfaces, and it changes with the scan rate either linearly or with the square root of the scan rate, depending on the type of electron transfer.

The capacitive current resulting from a linear scan iC,ls is a constant value given by the product of the double layer capacitance Cdl and the scan rate.
Find out more about the differences between linear and staircase cyclic voltammetry on a commercial capacitor in our free Application Note.
Staircase scans
When modern digital electronics became more commercially available and economically feasible, PGSTAT manufacturers adopted them, together with personal computers, to control PGSTATs. This allowed researchers to create more complex procedures as well as to perform data analysis via software. Metrohm Autolab was the first company to deliver computer controlled PGSTATs to the market back in 1989.
In the case of a digital scan, the applied potential versus time plot between an initial and end potential has the typical «staircase» shape of a digitized signal. The interval time tint defines the duration of each step, while the step potential Estep defines the potential difference between two consecutive steps (Figure 2).

The resulting current is measured at the end of the step. The measurement time defines the sampling time.
In a digital scan, the step potential Estep results in a capacitive current iC,ss which rises almost immediately up to the maximum value allowed by the current range, lim(CR), and then it decays exponentially as time constant t = RC. After the decay of the capacitive current, the faradaic current if is predominant.
The current is measured at the end of the step in order to remove the capacitive current and collect only the faradaic one (Figure 3).
 and current profile for a staircase scan. The current profile is divided into capacitive current iC,ss (black line) and faradaic current if (purple line). Total current itot is shown in dark red. The measurement (sampling) time is also shown here. For clarity, the decay of the capacitive current and the decay of the faradaic current are not in scale.")
Application examples: staircase or linear scan?
Capacitors
Some electrochemical processes can result in a capacitive current, having a characteristic time comparable to the charging of the double layer. In such cases a digital scan would neglect such capacitive currents and all of the information contained within them.
This is the case of highly capacitive cells, such as capacitors and supercapacitors.
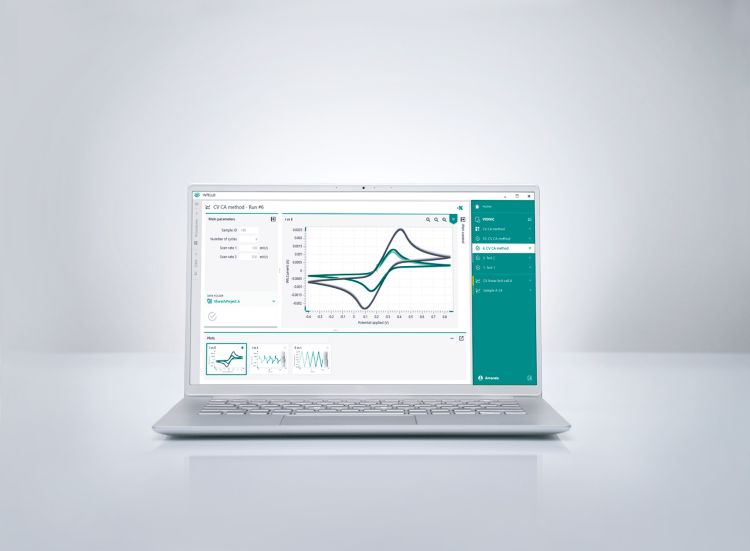
In Figure 4, cyclic voltammograms at different scan rates of a commercial 1 µF capacitor are shown. The diagram on the left shows the results from the digital scan, and on the right are the results from the analog scan [1].

It is pretty clear that the digital scan results do not contain any information about the charge/discharge of the capacitor, while the analog scan results have the expected shape of a capacitor’s cyclic voltammograms.
Adsorption/desorption processes
Another application example includes cells in which fast adsorption/desorption of species at the electrode surface occurs in a short time, like the adsorption/desorption of hydrogen as part of the electrochemical behavior of platinum submerged in an aqueous solution of sulfuric acid (Figure 5).

Here, the fast adsorption/desorption of hydrogen occurs at time scales that are similar to the charging of the double layer in the capacitor example. Therefore, the linear scan is the preferred option, compared to the digital staircase scan which is unable to capture the hydrogen adsorption/desorption (Figure 6) [2].

Redox reactions
Another example of experiments in which the capacitive current should not be neglected are redox reactions in which the electron transfer is very fast. In these situations, the charge transfer resistance is very small and the cyclic voltammogram results in redox peaks which are symmetrical over the potential axes. Examples include redox reactions on species adsorbed on the working electrode surface [3].
VIONIC: the future of electrochemistry
The most recent generation of PGSTATs, such as VIONIC, are equipped with electronics that allow to users perform analog scans without the drawbacks mentioned earlier. This gives researchers the opportunity to choose the type of scan according to the type of systems being studied, the materials, and the importance of the capacitive current for the outcomes of the research.

Your knowledge take-aways
VIONIC: Maximum experimental possibilities, intelligent software, and the most complete data
References
[1] Locati, C. Comparison between linear and staircase cyclic voltammetry on a commercial capacitor, Metrohm AG: Herisau, Switzerland, 2021. AN-EC-026
[2] Locati, C. Study of the hydrogen region at platinum electrodes with linear scan cyclic voltammetry – How VIONIC powered by INTELLO can be used to characterize processes at the Pt-electrolyte interface, Metrohm AG: Herisau, Switzerland, 2021. AN-EC-025
[3] Chi, Q.; Zhang, J.; Andersen, J. E. T.; Ulstrup, J. Ordered Assembly and Controlled Electron Transfer of the Blue Copper Protein Azurin at Gold (111) Single-Crystal Substrates. J. Phys. Chem. B 2001, 105 (20), 4669–4679. doi:10.1021/jp0105589