Green hydrogen, future fuel: Using potentiostats to develop new catalysts for hydrogen production
Jun 21, 2021
Article
 Share via email
Hydrogen – clean and green?
Due to its high gravimetric energy density and zero pollution emission, «green hydrogen» is a clean and sustainable energy carrier which is expected to become one of the fuels of the future. Green hydrogen is produced with renewable energy sources, and it can help to mitigate global warming by using cleaner fuels.
Producing green hydrogen with electrolysis
The most favorable way to produce green hydrogen is via water splitting electrolysis, where water (H2O) is broken down into its counterparts by using a direct electric current. Electrolysis is a sophisticated technique that has been used for many decades in industry. When using this technique for the production of hydrogen, drawbacks are the sluggish reaction kinetics when using inexpensive catalysts or the high costs for more optimal catalysts (e.g. platinum). To produce hydrogen in an efficient and economical manner, the goal for researchers around the world is to develop catalysts for this purpose which are highly active, inexpensive, and stable over long periods.
This article explains in more detail how Metrohm potentiostats can be used to characterize recently developed catalysts for electrochemical hydrogen production.
Electrode reactions
Considering alkaline solutions, the water splitting reaction can be described by two half reactions (Figure 1):
- Hydrogen Evolution Reaction (HER) at the cathode
- Oxygen Evolution Reaction (OER) at the anode

A critical issue for water splitting is the slow reaction kinetics of the half reactions. To overcome this, electrocatalysts which decrease the activation energy to an acceptable value need to be designed. For an ideal catalyst, a voltage of 1.23 V (at 20 °C and 1013 mbar) would have to be applied to begin hydrogen and oxygen evolution between the electrodes. Unfortunately, when using catalysts in real life situations, voltages above 1.8 V need to be applied.
Requirements for suitable catalysts
Catalysts
for the production of green hydrogen from electrochemical water splitting reactions must be:
- active
- stable
- highly efficient
- cost-effective
The first three properties can be determined by electrochemical measuring techniques using a potentiostat.
Activity
The activity of a catalyst is characterized by three values:
overpotential
Tafel slope
exchange current density
which can be obtained from the polarization curve as displayed in Figure 2.
 and a real catalyst (dark blue) considering the Hydrogen Evolution Reaction (HER) and Oxygen Evolution Reaction (OER).")
Linear polarization
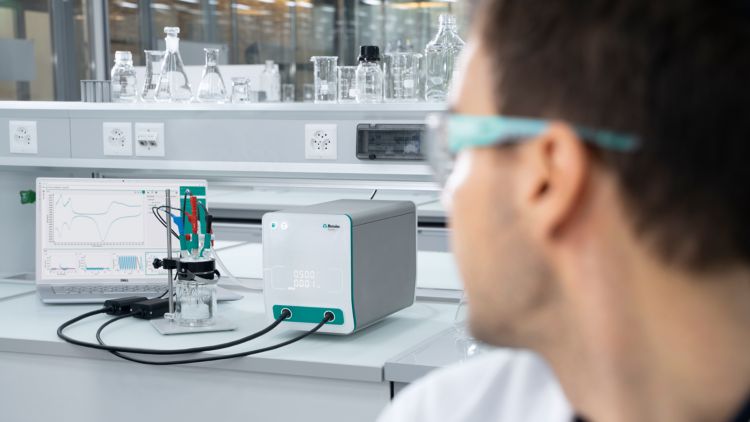
To record a polarization curve (Figure 2), a potentiostat is used in combination with a three-electrode setup. The working electrode is coated with the catalyst which is to be characterized. A typical setup for this purpose is shown in Figure 3.
 as working electrode to keep mass transport under defined conditions.")
During the measurement, the potential (beginning at a defined initial potential value) is swept to the end potential in a linear fashion over a certain time interval (Figure 4). For HER-catalysts, the potential is swept in the negative direction compared to the initial potential; catalysts used for OER purposes are swept to positive potentials with respect to the initial potential.
The overpotential (η) is a very important parameter to evaluate the activity of the catalyst; its value is affected by the kinetic barrier for the reaction. To overcome this barrier, a higher potential than the thermodynamic potential (1.23 V for OER, or 0 V for HER) – the overpotential – has to be applied to reach the same current densities. The more active the catalyst, the lower the overpotential.

Tafel analysis
Aside from the overpotential, the Tafel slope and exchange current density are two additional parameters that help characterize the activity of the catalyst. They can be accessed by plotting the logarithm of the kinetic current density versus overpotential to create the so-called «Tafel plot» (Figure 5).

By evaluating the Tafel plot, these two important kinetic parameters can be extracted. One is the Tafel slope (b) which can be expressed by the following equation:
η = a + b log i
- η = overpotential
- i = current density
The other parameter is the exchange current density (i0), which can be obtained by extrapolating the current at zero overpotential (Figure 6).
The Tafel slope is related to the catalytic reaction mechanism in terms of electron-transfer kinetics. For example, faster electrocatalytic reaction kinetics lead to a smaller Tafel slope which is shown in a significant current density increment as a function of the overpotential change (Figure 6).
Koutecký and Levich analysis
The exchange current density (i kin0) describes the charge transfer under equilibrium conditions. A higher exchange current density means a higher charge transfer rate and a lower reaction barrier. As explained earlier in this article, for a better electrocatalyst, a lower Tafel slope and a higher exchange current density are expected.
When performing real experiments, mass transport is the limiting factor at higher overpotentials (Figure 5) which leads to a nonlinear slope of the Tafel plot.
To overcome the undesirable impacts of mass transport (e.g., diffusion), a Rotating Disc Electrode (RDE) (Figure 3) is used. The current signal is therefore measured at different rotation rates. From this data set, it is possible to extract the pure kinetic current (i kin0) according to Koutecký and Levich (Figure 6).
 is determined by extrapolation to η = 0.")
You can find more information about Koutecký and Levich analysis by downloading our free Application Note:
Oxygen Reduction Reaction with the Rotating Ring Disk Electrode
Impedance analysis
Another measuring technique can be used to determine the reaction kinetics of catalysts: electrochemical impedance spectroscopy (EIS). One of the most important advantages of impedance spectroscopy is that it is a non-destructive and non-invasive measuring technique. This enables consecutive measurements to be performed on the same sample, such as experiments at different temperatures or at different current densities. Also, the aging effects of catalysts can easily be determined this way.
Impedance spectroscopy is an alternating electric current (AC) technique, where an AC voltage with a very small amplitude of a few millivolts is applied to the electrode which responds with an AC current. The values of the applied voltage signal and the values of the corresponding current signal are used to calculate the AC resistance—the impedance. A broad frequency range of several decades is applied and this enables the identification of the kinetic and transport processes that take place on the electrode over different time scales.
Displaying the impedance spectra in a Nyquist plot (Figure 7) exhibits the charge transfer resistance of the reaction as a semicircle. The diameter of this semicircle corresponds to the reaction kinetics: the smaller the diameter, the faster the kinetics of the reaction.

Electrochemical impedance spectroscopy does not only provide kinetic information to researchers, it also gives insight into mass transport effects and conductivity of electrolytes and membranes.
To find out more about EIS, check out our selection of free Application Notes.
Application Notes about Electrochemical Impedance Spectroscopy
Stability
For industrial use, a catalyst should exhibit an extremely low degradation rate. It needs to be stable for many operating hours. At the development stage, stability is an important factor to determine whether a catalyst has the potential for use in practical applications. Stability can be characterized by the changes of the overpotential or current over time by using chronoamperometry, chronopotentiometry, and cyclic voltammetry. These are described in the following sections.
Chrono methods (chronoamperometry and chronopotentiometry)

When using a chronoamperometry method, a constant voltage is applied to the catalyst and the corresponding current signal is sampled and plotted as an i/t curve (Figure 8).

Conversely, when using a chronopotentiometry method, a constant current is applied to the catalyst and the voltage response is measured and plotted as an E/t curve (Figure 9). For this measurement, the longer the tested current or potential remains constant, the better the stability of the catalyst.
Cyclic Voltammetry (CV)
Cyclic voltammetry is a technique that measures the current density by cycling the potential of the working electrode linearly versus time (Figure 10). In contrast to linear sweep voltammetry (Figure 4), after the end potential is reached, the potential in a CV experiment is scanned in the opposite direction to return to the initial potential.
 diagram with one cycle shown.")
To determine the degradation rate of a tested catalyst, usually more than 5000 cycles must be executed with a scan rate between 50–100 mV/s. Before and after CV cycling, linear sweep voltammetry (LSV) is used to examine the overpotential shift at a specific current density.
The smaller the change of the overpotential, the better the electrocatalyst’s stability.
Learn more about cyclic voltammetry (CV) with our free Application Note:
Differences between digital scans, analog scans, and signal integration
Efficiency
The efficiency (η) can be determined by the faradaic efficiency (or coulombic / coulombian efficiency) in terms of experimental results compared to theoretical predictions.

To be able to calculate the theoretical hydrogen volume via Faraday’s Law, the total charge is needed. This value is measured by the potentiostat using the chronocoulometry method which records the total charge over time (Figure 11).

Conclusion
Choosing the right technique for the analysis of activity, stability, and efficiency of catalysts depends on the specific research and development project focus. Luckily, Metrohm offers a wide range of solutions that will meet all kinds of research requirements.