From corn to ethanol: improving the fermentation process with NIRS
Aug 9, 2021
Article
 Share via email
The production of biofuels from renewable feedstock has grown immensely in the past several years. Bioethanol is one of the most interesting alternatives for fossil fuels, since it can be produced from (renewable) raw materials rich in sugars and starch.
Fermenting corn starch to produce ethanol for fuel is a complex biochemical process that requires monitoring of several parameters to ensure optimal production. Measuring these parameters via traditional laboratory techniques takes about an hour to complete and is a limiting step for increasing plant capacity and efficiency. Near-infrared spectroscopy (NIRS) can replace routine laboratory analysis, decreasing operating costs and increasing plant efficiency and capacity.
Learn more about this fast, non-destructive analysis technique in our different series of blog posts, including the benefits of using NIRS and some frequently asked questions.
Benefits of NIR spectroscopy: Part 1
Frequently asked questions in near-infrared spectroscopy analysis – Part 1
Producing high quality ethanol as a fuel additive

Ethanol is an increasingly important component in the global fuel market, with countries looking to secure domestic fuel supplies and reduce their greenhouse gas emissions relative to fossil fuels. The United States and Brazil lead world bioethanol production, accounting for 83% of the supply.
According to the Renewable Fuels Association, approximately 26 billion gallons (nearly 100 billion liters) of ethanol were produced globally in 2020 [1], slightly reduced from a 2019 peak due to the global pandemic crushing demand for gasoline and ethanol as well. Demand for corn to transform into ethanol is still likely to rise as the United States increases adoption of E15 blends (15% ethanol in gasoline) [2]. Ethanol for export is also likely to increase in demand, with countries such as China implementing a E10 fuel standard for motor vehicles.
One of the primary ways to meet increasing product demand while maintaining price competitiveness is to increase plant capacity. However, the standard laboratory analytical workflow for monitoring the different parts of the fermentation process can be a limiting factor for growing a production site or improving its efficiency. Another consideration is the seasonal, and even regional variation of feedstock quality, requiring ethanol producers to closely monitor the fermentation process to ensure the same quality product is achieved.
A report from the National Renewable Energy Laboratory estimated that nearly 40% of the production cost of fuel ethanol from corn comes from labor, supplies, overhead, and variable operating costs [3]. Optimization of these costs, which include routine quality checks of the fermentation broth, regular maintenance of the fermenters and distillation towers, and triaging process upsets in a timely manner, leads to higher profitability of the ethanol production facility.

To maximize bioethanol production and profitability, laboratory limitations must be overcome. Near-infrared (NIR) spectroscopy is a proven economical, rapid, and operator friendly way to overcome common laboratory limitations. First, a bit of background information about the production of bioethanol is needed before jumping into how to optimize the process.

Ethanol process: wet vs. dry milling
There are two main production processes when it comes to creating ethanol from sugars and starches from starting materials such as corn: the wet milling process and the dry milling process (shown in Figure 1). Nearly all ethanol produced for fuel in the U.S. (the largest bioethanol manufacturer in the world) is made using the dry mill process [2].
Grains are first ground into smaller, more homogenous particles in the dry milling process, which allows the husk or shell to be more easily penetrated. Water and enzymes are then added to create a slurry called a «mash». To facilitate the conversion of starches to sugars, the mash is heated to specific temperatures, then cooled before yeast is added. The yeast performs the work of creating ethanol from the converted sugars via the process of fermentation. However, the percentage of ethanol is still quite low, and therefore the solution must be distilled and dehydrated to obtain the concentration and purity necessary for fuel additives.
Wet milling differs from this process by first soaking the grains before grinding and separating out the various components. The starches are then converted to sugars which are used for the fermentation process, just as with dry milling.
If you want to know more about the fermentation process, read our blog post about optimization of beer brewing.
Lab analysis shortfalls
The lab serves many functions, but one of the key ones is to monitor the progress of the fermentation in each fermentation tank. This typically requires many different technologies, because several parameters must be checked to ensure that a fermentation is on track. Tight monitoring and control over the various sugars present (e.g., glucose, maltose, DP3, etc.) throughout the fermentation process is necessary to understand the breakdown pathway of the starch (glucose generation) present in the mash and optimize ethanol production. Understanding this pathway enables the proper dosage of enzymes and yeast to the mash in the slurry tanks (Figure 1) to accelerate breakdown. Therefore, optimizing the enzyme and yeast blend is crucial for this process. These are the highest consumable costs for ethanol production and significantly affect the rate of production and final yield of ethanol.
Some of the most common analytical instruments and their use cases are listed in Table 1.
| Parameter | Measurement technique | Analysis time (min) incl. sample prep. |
| Dissolved solids (°Bx) | Refractometer | 3–5 |
| pH | pH meter | 3–5 |
| Solids (non-volatiles) | Infrared balance | 15–20 |
| Ethanol | HPLC | 30–45 |
| Sugar profile (DP2, DP3, DP4+, glucose, total sugar) | HPLC | 30–45 |
| Glycerol | HPLC | 30–45 |
| Lactic acid | Ion chromatography | 30–45 |
| Acetic acid | Ion chromatography | 30–45 |
| Water content | Karl Fischer titration | 5–10 |
If all of the properties in Table 1 are to be measured, it can easily take an hour using six different pieces of equipment. Factor in conditioning steps and reference scans to ensure proper calibration, and the time for a routine fermentation analysis increases. For a single corn fermentation, this can take upwards of 55 hours—one hour to perform the analysis and six hours between each measurement. However, increasing the number of concurrent fermentations to four or six means that measurements from the different tanks will begin to overlap.
Overlapping instrument demand combined with long analysis times results in a number of different challenges for bioethanol producers. First, if scheduled sampling times overlap, then sampling must either be delayed or samples must age while waiting for analysis. Second, the long analysis time means that data is no longer current, but minimally one hour or older by the time it has been communicated to the plant control center, which decreases the ability to deal with deviations. Neither of these situations is ideal for manufacturers—time is money, after all.

Long laboratory analysis times and infrequent measurements reduce the ability to perform interventions or to adjust other critical parameters (e.g., enzyme addition rate or process temperature). Additionally, such long wait times can impede the decision to end a fermentation early and begin anew if the batch is judged to be beyond recovery.
Faster measurements equal higher profits
The most obvious way to overcome measurement time challenges is to increase the number of tools in the lab and/or to add automation. However, this approach has costs in time; twice the sample preparation increases operating expenses and still fails to give high-speed feedback to the plant operations team.

A better way to overcome measurement time delays is to deploy near-infrared spectroscopy (NIRS), which can make all of the traditional laboratory measurements with one piece of equipment, at the same time, in less than five minutes.
Figure 2 displays the average ethanol concentration from HPLC measurements during several fermentations from one plant. The data shows apparent discontinuities in the first 12 hours, with spikes in glucose and dissolved solids. It is also apparent that the total solids measurement at 48 hours is erroneous. However, because the lab data requires so much time to collect, this spike is ignored instead of retested.

The NIRS alternative to traditional measurements, shown in Figure 3, is of a single fermentation monitored in near real time. This high-speed analysis is possible because sample preparation is trivial for NIRS. Compared to the combination of HPLC and other analytical methods that consume about 60 minutes of operator time per sample, NIRS measures the same parameters and produces a quality result in about a minute. The ability to collect many NIR spectra in the early stages of the fermentation process provides a higher fidelity picture, enabling more timely interventions to maximize ethanol production.
The higher speed NIRS analysis can be used to increase total plant throughput by growing the number of batches and revenue, as shown in Table 2. With the traditional analysis, the fermentation is allowed to run 62–65 hours, depending on the final laboratory results (Figure 2).
With NIRS analysis, this fermentation is shown to be complete in around 56 hours (Figure 3). Reducing fermentation time by six hours expands the potential number of batches by 13 over the course of a year, representing a potential plant capacity increase of 10%.
| Traditional Lab Analysis | NIRS Analysis | |
| Total measurement time | 12 hours | 5 hours |
| Number of measurements | 12 | 62 |
| Fermentation end point | ~62 hours | 56 hours |
| Batch capacity | 37,850 L | 37,850 L |
| Batches per year | 129 | 142 |
Download our free white paper to learn more
This free white paper discusses the advantages of near-infrared spectroscopy compared to traditional measurements (e.g., HPLC), how near-infrared spectroscopy can increase plant capacity, ways to decrease costs through more effective process interventions, and how Metrohm delivers ethanol solutions through the cloud.

Near-infrared spectroscopic solutions for ethanol producers
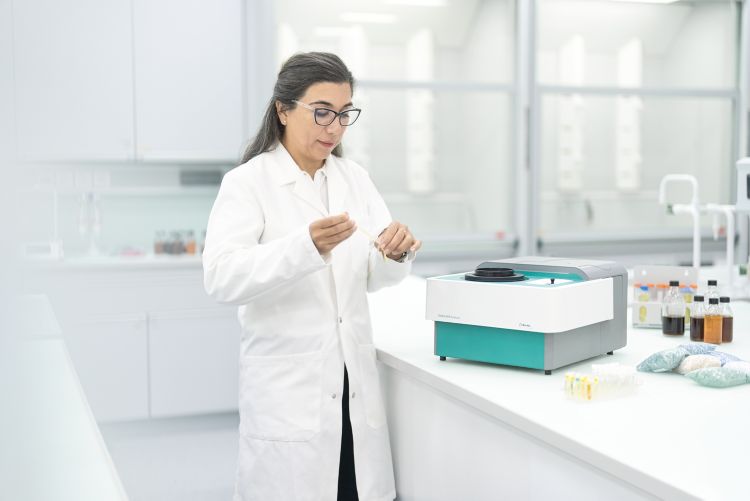
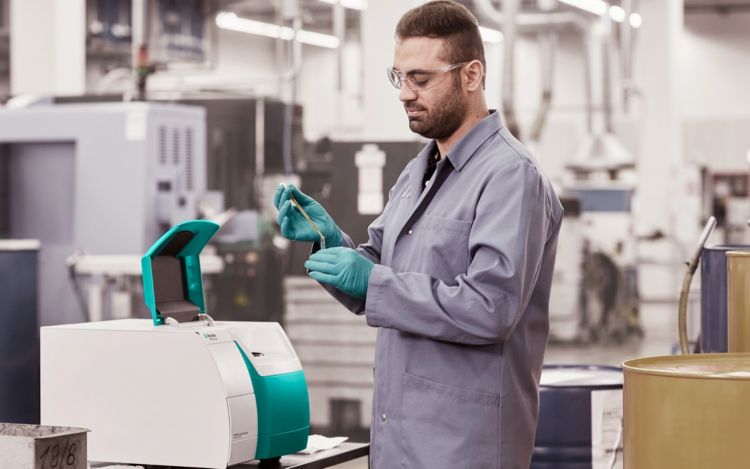
Metrohm offers several NIRS solutions for ethanol producers to make analysis easier and optimize production. The DS2500 Solid Analyzer (Figure 4) is ideal for rapid laboratory analysis of several critical quality parameters in the fermentation process.
Download our free Application Note below to learn more about how Metrohm NIRS laboratory instruments perform quality control measurements for the fermentation process.
Quality Control of fermentation processes – Multiparameter determination within one minute
Additionally, Metrohm also manufactures NIRS instruments for measurements directly in the process, eliminating the need for removing samples and transporting them to the laboratory. Measurements taken in this way are the most representative of actual process conditions and therefore provide the highest quality data to operators.
Learn more here about our different ranges of NIRS process analyzers and accessories.
Data communication between the process analyzer and the control room allows a direct overview of current conditions without delays and offers the possibility of integrating warnings when readings are out of specification or informing operators when the fermentation process is deemed to be complete.
For more information about the usage of NIRS for process analysis in bioethanol production, download our free Process Application Note.
Summary
Near-infrared analysis decreases measurement time for in-process fermentation samples by approximately 90%, from one hour to five minutes. Faster measurements allow the fermentation process to be followed much more closely, saving operator time to reduce costs and to optimize process conditions and plant operations. Capacity improvements of 10% are possible by being able to stop the fermentations based on rapid determination of the different parameters in the fermenter with NIRS rather than by slower traditional laboratory methods.
NIR methodology can provide benefits across the ethanol plant beyond fermentation monitoring to measure the performance of other plant components such as a centrifuge or dryer, making it a valuable tool to improve operations across the facility.
References
[1] Annual Fuel Ethanol Production U.S. and World Ethanol Production. Renewable Fuels Association: Washington, DC, 2021. https://ethanolrfa.org/statistics/annual-ethanol-production/
[2] Essential Energy: 2021 Ethanol Industry Outlook. Renewable Fuels Association: Washington, DC, 2021. https://ethanolrfa.org/wp-content/uploads/2021/02/RFA_Outlook_2021_fin_low.pdf
[3] Determining the Cost of Producing Ethanol from Corn Starch and Lignocellulosic Feedstocks. National Renewable Energy Laboratory (NREL): Golden, Colorado, USA, 2000. https://www.nrel.gov/docs/fy01osti/28893.pdf