What is NIR spectroscopy?
8. 1. 2024
Článek
 Sdílet článek
Near-infrared spectroscopy, also known as NIR spectroscopy or NIRS, has been an established analytical technique for more than 30 years. It is a fast and reliable method to measure chemical and physical properties in solids and liquids. This first part of the series about near-infrared spectroscopy gives an introduction to how it works and presents the advantages and versatility of the technique.
Click to go directly to a topic:
How does NIR spectroscopy work?
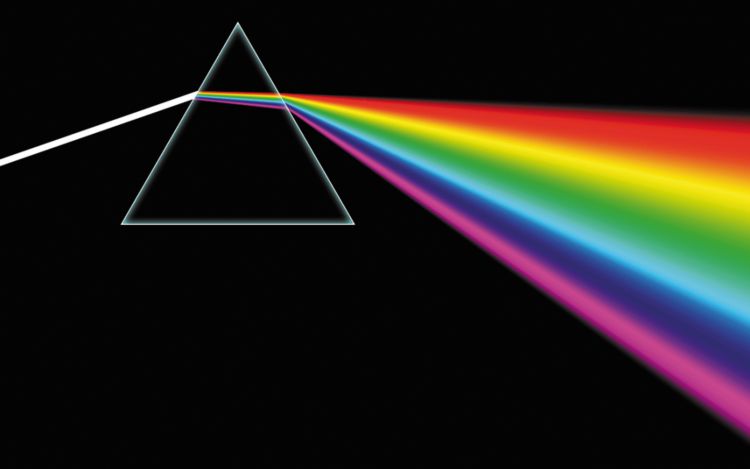
NIR spectroscopy analyzes the interaction between light and matter to generate a spectrum. In spectroscopic methods, light is typically not described by the applied energy, but by the wavelength. NIR spectroscopy operates in the near-infrared region of the electromagnetic spectrum, i.e., in the wavelength range of 780 to 2500 nm. In other words, a NIR spectrometer measures the absorption of light from the sample at different wavelengths in the NIR region. It must be noted that near-infrared is a different wavelength range than mid-infrared. The difference between these two techniques is explained in the blog article «NIR vs. IR: What is the difference?».
NIRS is a secondary technique. This means a prediction model needs to be created first. You can compare this, for example, to HPLC. If you want to identify or quantify a substance with HPLC, first you need to prepare standard solutions of the substance and measure them to create a calibration curve.
This is similar with NIRS: first you need to measure a number of spectra with known concentrations or known parameter values that were gathered from a primary method such as titration. A prediction model is created out of these spectra using chemometric software (e.g., the Metrohm OMNIS software). Then, routine analysis of unknown samples can start. We explain in more detail how prediction models are created in the blog article «How to implement NIR spectroscopy in your laboratory workflow».
NIR spectroscopy is especially sensitive to the presence of certain functional groups including -CH, -NH, -OH, and -SH. Therefore, it is an ideal method to quantify chemical parameters such as water content (moisture), hydroxyl value, acid number, and amine content, just to name a few.
In addition, the interaction between light and matter is also dependent upon the matrix of the sample itself, which allows the detection of physical and rheological parameters such as particle sizing, density, intrinsic viscosity, and melt flow rate.
Measuring methods for solid and liquid samples
To understand the benefits of NIR technology, it is important to start by understanding how we measure NIR spectra. NIR spectroscopy enables the analysis of different types of samples. Depending on the sample type, researchers require different instruments.
Several measurement methods are available for samples ranging from clear liquids to opaque pastes and powders. Choosing the right measurement method, sampling module, and accessories is the most important step to developing robust NIR methods. Below, we show the different methods for various sample types (diffuse reflection, transflection, and transmission).
Measuring method for solid samples
Diffuse reflection: Cream, paste, granulates, coarse and fine powders
NIR light penetrates into and interacts with the sample. The unabsorbed NIR energy reflects back to the detector. This method is most suitable to measure solid samples without sample preparation.
Example for measuring a solid sample

Solid samples (e.g., powders) must be placed on the window as shown here, secured within an appropriate container or vial.
The NIR radiation comes from below, and is partially reflected by the sample to the detector, which is also located below the sample vessel plane. After 45 seconds, the measurement is completed and a result is displayed. As this reflected light contains all the relevant sample information, this measurement technique is called diffuse reflection.


Measuring methods for liquid samples
Transflection: Liquids and gels
This measurement method is a combination between transmission and reflection. A reflector is placed behind the sample. The reflector reflects the unabsorbed NIR light back to the detector. This method is most suitable to measure liquid samples.
Transmission: Liquids
Here, the sample is placed between the NIR light source and the detector. NIR light is transmitted through the sample, and any unabsorbed NIR energy continues to the detector. This method is most suitable to measure clear liquid solutions or suspensions.
Example for measuring a liquid sample

As the image illustrates, for a NIR analysis of liquid samples, a vial or cuvette must be inserted into the sample holder. After pressing start, a result is obtained after 45 seconds.
In this case, the NIR radiation travels through the solution before reaching the detector. This measurement technique is known as transmission.

Advantages of NIR spectroscopy
The procedure for obtaining the NIR spectrum already indicates two main advantages of near-infrared spectroscopy: simplicity regarding sample measurement and speed. These and other advantages of NIR analyses are listed here:
- Fast technique – results in less than 1 minute.
- No sample preparation required – solids and liquids can be used in pure form.
- Low cost per sample – no chemicals or solvents needed.
- Environmentally-friendly technique – no waste generated.
- Non-destructive – precious samples can be reused after analysis.
- Easy to operate – inexperienced users are immediately successful.
NIR spectroscopy applications
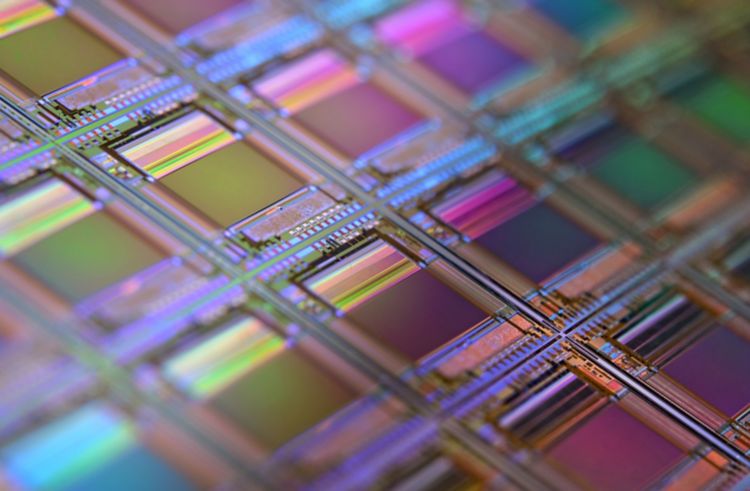
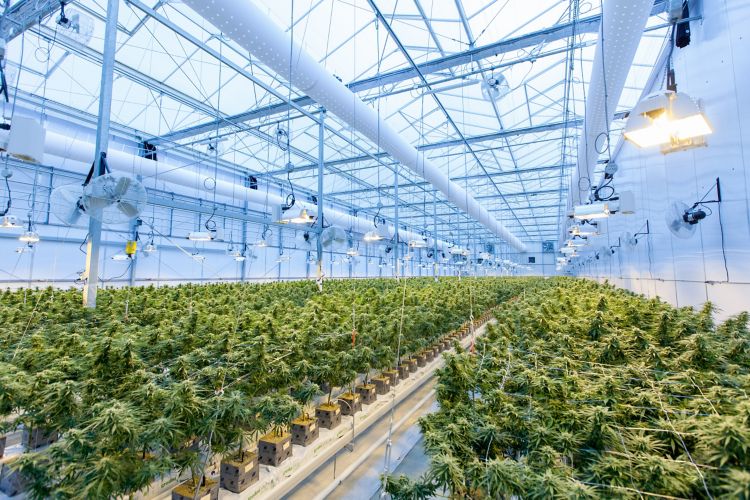
NIRS is a versatile technique and can be used for various applications, both for the analysis of chemical and physical parameters. NIR analysis is implemented in the chemical, polyol, polymer, food and beverage, animal feed, pharma, pulp and paper, paint, petrochemical, biofuel, personal care, textile, and semiconductor industries. Typically, NIR instruments are used for quality assurance and quality control, raw material identification or verification of chemical composition, process control and real-time reaction monitoring, and screening.

You can find different application examples in dedicated blog articles:
Polymers: Density of Polyethylene (PE); Melt Flow Rate; Intrinsic Viscosity
Chemical: Hydroxyl number of polyols
Petrochemical: Research Octane Number (RON) of gasoline; cetane index for diesel
Oils and Lubricants: Total Acid Number (TAN)
Pharma: Water content of lyophilized products; content uniformity in tablets
Personal care: Moisture content and active ingredients in creams
Pulp and paper: Kappa number, applied density, pulp freeness, breaking strength, buckling strength, and tensile strength in wood pulp
Paint and ink: Content of dye, diethylene glycol (DEG), surfactant, and water in ink, plus cobalt and solids content, specific gravity, and viscosity determination in paint
Food: Multiparameter analysis of various edible oils
Beverages: Caffeine, water activity, density, and moisture analysis in coffee
Surface finishing: Monitoring critical parameters in cleaning, degreasing, rinsing, and phosphatizing baths
Semiconductors: Controlling the composition of chemical etching, cleaning, and rinsing baths
Biofuel: Monitoring ethanol production in the fermentation process

You can also browse our Application Finder for NIR spectroscopy applications:
Near-infrared spectroscopy is a reliable method to measure chemical and physical properties in solids and liquids. This fast method can also be successfully implemented to be used by staff without any laboratory education for routine analysis.
Now that you know what NIR spectroscopy is, learn how it can be easily implemented into your laboratory workflow:
How to implement NIR spectroscopy in your laboratory workflow
Your knowledge take-aways
Learn more about our NIR spectrometers for lab and process analysis, as well as Raman solutions
A guide to near-infrared spectroscopic analysis of industrial manufacturing processes
To learn more about the spectroscopic details of NIR spectroscopy, e.g. overtones and combination bands, multivariate data analysis and chemometrics, download this monograph.