Photometric complexometric titration
May 25, 2020
Article
 Share via email
Complexometric titration was discovered in 1945 when Gerold Schwarzenbach observed that aminocarboxylic acids form stable complexes with metal ions, which can change their color by addition of an indicator. From the 1950’s on, this technique gained popularity for the determination of water hardness. Soon it was clear that aside from magnesium and calcium, other metal ions could also be titrated in this way. The use of masking agents and new indicators gave further possibilities to determine not only the whole amount of metal ions present in solution, but also to separate and analyze them. A new titration type was born: complexometric titration.
Have you ever performed a complexometric titration? Many of you will respond “yes” as it is one of the most frequently used types of titration. However, you have probably struggled over the detection of the endpoint and over the titration itself. In contrast to other types of titrations, the boundary conditions such as pH and reaction time play an even bigger role in complexometry since the complex binding constant is very pH dependent and the reaction might be slow. This article presents the most common challenges and how to overcome them when carrying out complexometric titrations.
For a complexometric titration analysis, it is very important to know the qualitative composition of your sample. This determines the indicator, the complexing agent, and the masking agent you need to use.
The following topics will be covered (click to jump directly to a section):.

Complexometric reactions always consist of a metal ion which reacts with a ligand to form a metal complex. Figure 1 shows an example of such a chemical reaction of a metal ion Mn+ with ethylenediaminetetraacetic acid (EDTA). EDTA is the most commonly used titrant for complexometric titrations and reacts in a stoichiometric ratio of 1:1. As shown on the right side of Figure 1, EDTA can form six coordinational bonds, in other words: EDTA has a denticity of six. The more coordinational bonds a ligand can form, the more stable the formed complex is.
As with most chemical reactions, this type of reaction stays in an equilibrium. Depending on the metal ion used, this equilibrium can shift more to the left (reactants) or on the right (products) of the equation. For a titration, it is mandatory that the equilibrium is on the right side (complex-forming). The equilibrium constant is defined as shown in Equation 1.

Equation 1 also illustrates why it is so important to keep the pH value constant. The concentration of hydronium ions influences the complex-forming constant by a factor of the square of its concentration (e.g., if one titrated with H2Na2EDTA). This means if the pH value of the reaction is changed, its complex-forming constant is also changed, which influences your titration.
Generally, the higher the concentration of the complex in comparison to the free metal / Ligand concentration, the higher the Kc and also the log(Kc) value. Some log(Kc) values are shown later on in Table 2 and can give you a hint regarding which titrant is most suitable for your titration.
Complexometric reactions are often conducted as a photometric titration. This means an indicator is added to the solution so that a color change at the endpoint can be observed.
Color Indicator
As in acid–base titration, the color indicator is a molecule which indicates when the end of titration (the endpoint, or EP) is reached by a change in the solution color. For acid–base titration, the color change is induced by a change of pH, whereas in complexometric titration the color change is induced by the absence/presence of metal ions. Table 1 gives you an overview of different color indicators and the metals which can be determined with them.
Table 1. List of color indicators for different kinds of metal ions.
| Indicator | Element | Color with metal ion | Color without metal ion |
| Pyrocatechol violet | Bi3+, Cd2+, Co2+, In3+, Mn2+, Zn2+ | blue | yellow |
| Dithizone | Zn2+ | red | green-violet |
| Eriochrome Black T | Ca2+, Cd2+, Hg2+, Mg2+, Pb2+, Zn2+ | red | blue |
| Calconcarboxylic acid | Ca2+ in the presence of significant Mg2+ | red | blue |
| Hydroxynaphthol blue | Ca2+, Mg2+ | red | blue |
| Murexide | Co2+, Cu2+, Ni2+ | yellow | violet |
| PAN | Cd2+, Cu2+, Zn2+ | red | yellow |
| Phthalein purple | Ba2+, Ca2+, Sr2+ | purple | colorless |
| Tiron | Fe3+, SO42- | blue | yellow |
| Xylenol orange | Al3+, Bi3+, La3+, Sc3+, Th4+, Zr4+ | red | yellow |
It is very important to choose the right indicator, especially when analyzing metal mixtures. By choosing an appropriate indicator, a separation of the metal ions can already take place.
As an example, consider a mixture of Zn2+ and Mg2+ which is titrated with EDTA. The log(Kc) value for the zinc ion is 16.5, and 8.8 for the magnesium ion. If we choose to titrate this sample with PAN-indicator then the indicator will selectively bind to the zinc, but not magnesium. As zinc has the higher complex-formation constant, the zinc ion will react first with EDTA, leading to a color change, and the endpoint can be detected. In such a case, the separation of the ions is possible. If this is not the case, the choice of a more suitable complexing agent might help you to obtain a separation of metal ions.
Complexing agent
At the beginning of your titration, the metal ions are freely accessible. By adding the complexing agent (your titrant), the metal ions become bound. The prerequisite for that is a higher complex-formation constant of the metal with the complexing agent than with the indicator. In 95% of cases, this does not pose a problem. Some complexing agents are mentioned in Table 2. In general, ions with higher charges will have a higher complex-formation constant.
However, what can you do if you are still not able to separate your metal ions sufficiently and determine them individually? The answer to that is: use a masking agent to make the second metal ion “invisible” to the titrant.
Table 2. Complex-formation constants log(Kc) of different complexing agents with various metal ions. The higher the number in the table the higher the binding strength between metal ion and ligand. As an example: aluminum binds stronger to DCTA than to EDTA.
| Metal ion | EDTA | EGTA | DCTA | DTPA | NTA |
| Al(III) | 16.4 | 13.9 | 18.6 | 18.4 | 9.5 |
| Ba(II) | 7.9 | 8.4 | 8.6 | 8.6 | 4.8 |
| Bi(III) | 27.8 | 23.8 | 31.2 | 29.7 | – |
| Ca(II) | 10.7 | 11 | 12.5 | 10.7 | 6.4 |
| Cd(II) | 16.5 | 16.7 | 19.2 | 19.3 | 9.5 |
| Co(II) | 16.5 | 12.5 | 18.9 | 18.4 | 10.4 |
| Co(III) | 41.4 | – | – | – | – |
| Cr(II) | 13.6 | – | – | – | – |
| Cr(III) | 23.4 | 2.5 | – | – | > 10.0 |
| Cu(II) | 18.8 | 17.8 | 21.3 | 21.5 | 13 |
| Fe(II) | 14.3 | 11.9 | 16.3 | 16.6 | 8.8 |
| Fe(III) | 25.1 | 20.5 | 28.1 | 28.6 | 15.9 |
| Ga(III) | 21.7 | – | 22.9 | 23 | 13.6 |
| Hf(IV) | 29.5 | – | – | 35.4 | 20.3 |
| Hg(II) | 21.5 | 23.1 | 24.3 | 27 | 14.6 |
| In(III) | 24.9 | – | 28.8 | 29 | 16.9 |
| Mg(II) | 8.8 | 5.2 | 10.3 | 9.3 | 5.5 |
| Mn(II) | 13.9 | 12.3 | 16.8 | 15.6 | 7.4 |
| Ni(II) | 18.4 | 13.6 | 19.4 | 20.3 | 11.5 |
| Pb(II) | 18 | 14.7 | 19.7 | 18.8 | 11.4 |
| Pd(II) | 25.6 | – | – | – | – |
| Sn(II) | 18.3 | 23.9 | – | – | – |
| Sr(II) | 8.7 | 8.5 | 10.5 | 9.7 | 5 |
| Th(IV) | 23.2 | – | 29.3 | 28.8 | 12.4 |
| Tl(I) | 6.4 | – | 5.3 | 6 | 4.8 |
| Tl(III) | 35.3 | – | 38.3 | 48 | 18 |
| Zn(II) | 16.5 | 14.5 | 18.7 | 18.8 | 10.7 |
| Zr(IV) | 29.3 | – | 20.7 | 36.9 | 20.85 |
DCTA: trans-Diaminocyclohexanetetraacetic acid
DTPA: Diethylenetriaminepentaacetic acid
EDTA: Ethylenediaminetetraacetic acid
EGTA: Ethylene glycol bis-(2-aminoethyl)tetraacetic acid
NTA: Nitrilotriacetic acid
Masking agents
In general, masking agents are substances which have a higher complex-formation constant with the metal ion than the complexing agent. Metal ions which react with the masking agent can no longer be titrated, and therefore the metal ion of interest (which does not react with the masking agent) can be determined separately in the mixture using the complexing agent. Table 3 shows a small selection of common masking agents. There are many more masking agents available which can be used for the separation of metal ions.
Table 3. A selection of different masking agents.
| Masking agent | Element / Compound |
| Ammonium fluoride | Al, Ti, Be, Ca, Mg, Sr, Ba |
| Potassium cyanide | Zn, Cd, Hg, Cu, Ag, Ni, Co |
| Acetylacetone | Fe, Al, Pd, UO2 |
| Tiron (dihydroxybenzenedisulfonic acid) | Al, Fe, Ti |
| Triethanolamine | Fe, Al |
| 2,3-Dimercaptopropanol (BAL) | Zn, Cd, Hg, As, Sb, Sn, Pb, Bi |
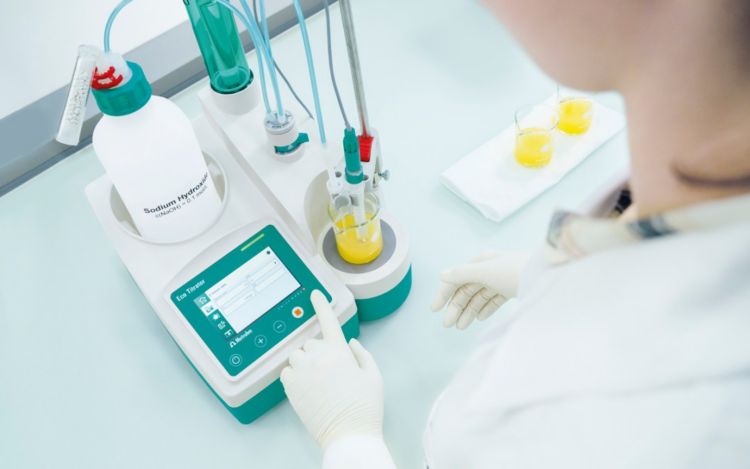
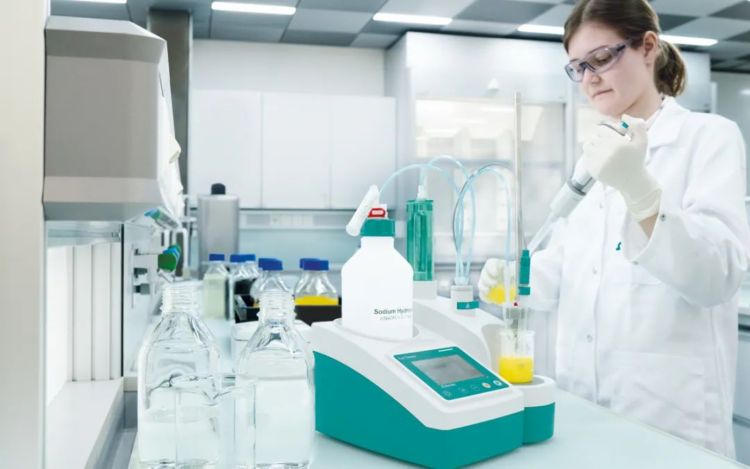
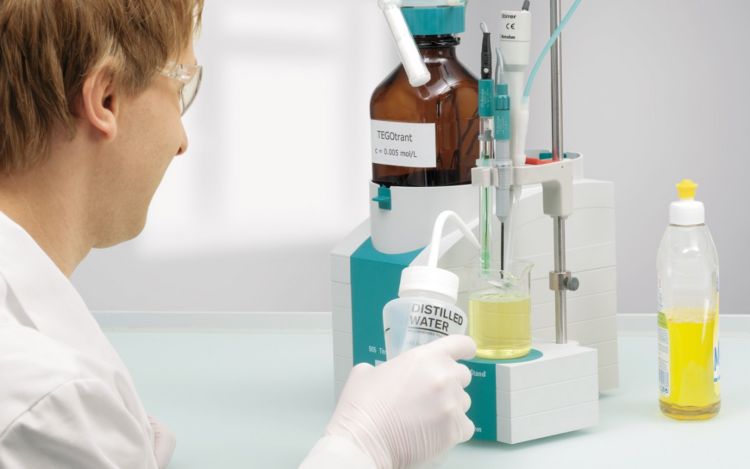
Complexometric titration is still often carried out manually, as the color change is easily visible. However, this leads to several problems. My previous article explains the many challenges of manual titration:
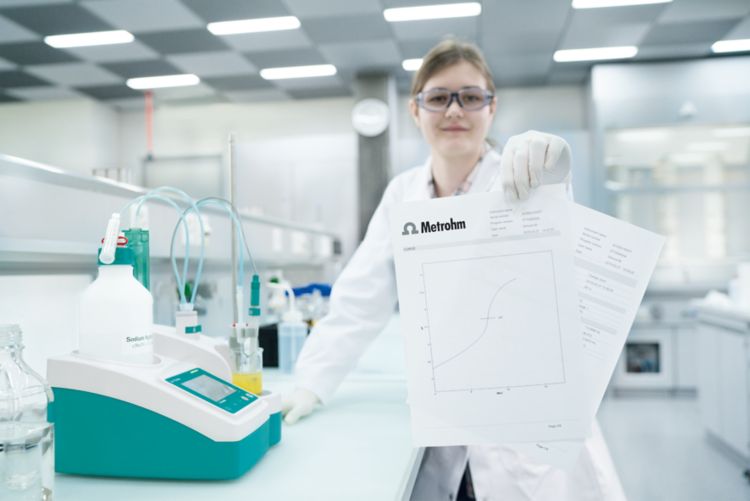
How to avoid titration errors in your lab
Subjective color perception and different readings lead to systematic errors which can be prevented by choosing a proper electrode or using an optical sensor, which accurately indicates the color change. This optical sensor changes its signal depending on the amount of light reaching the photodetector. It is usually the easiest choice when switching from manual titration to automated titration, because usually it does not require any changes to your SOP.

Which wavelength is optimal for indication?
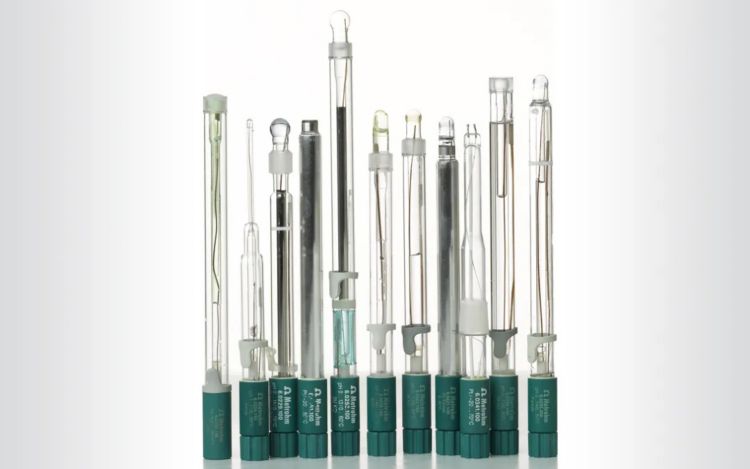
If you choose to automate your complexometric titration and indicate the color change with a proper sensor, you should use the Optrode. (Figure 2) This sensor offers eight different wavelengths enabling its use with many different indicators.
Perhaps you’re asking yourself “why do I need eight different wavelengths”? The answer is simple. This sensor monitors the absorbance of a certain wavelength in the solution. Each wavelength change is best detected when the light is strongly absorbed by the color of the sample solution, either before or after the endpoint is reached. For example, during a color change from blue to yellow, it is recommended to select the wavelength 574 nm (yellow) for the detection of the color change, as it is the complementary color of blue. For even more accuracy, the optimal wavelength can be chosen by knowing the UV/VIS spectra of the indicator before and after complexation.
 and uncomplexed (blue) Eriochrome Black T are shown. Right: the difference in absorption of the two spectra is shown.")
On the left side of Figure 3 is a graph with the spectra of complexed and uncomplexed Eriochrome Black T. The uncomplexed solution has a blue tint, whereas the complexed one is more violet. On the right, another graph shows the difference of both spectra. According to this graph, the maximum difference in absorption is obtained at a wavelength of 660 nm. Therefore, it is recommended to use this wavelength for the detection of the color change. For more examples of indicators and their spectra, check out our free monograph.
Challenges when performing complexometric titrations
As mentioned in the introduction, complexometric titrations are a bit more demanding compared to other types of titration.
First, the indicators themselves are normally pH indicators, and most complexation reactions are pH-dependent as well. For example, the titration of iron(III) is performed in acidic conditions, while the complexation of calcium can only take place under alkaline conditions. This leads to the fact that the pH has to be maintained constantly while performing complexometric titrations. Otherwise, the color change might not be visible, indicated incorrectly, or the complexation might not take place.
Second, complexation reactions do not occur immediately (e.g., precipitation reactions). The reaction might take some time. As an example, the complexation reaction of aluminum with EDTA can take up to ten minutes to be completed. Therefore, it is also important to keep this factor in mind.
Perhaps a back-titration needs to be performed in such a case to increase accuracy and precision. Read our our blog post below for more information about this topic.
Summary
Complexometric titrations are easy to perform as long as some important points are kept in mind:
- If more than one type of metal is present in your sample, you might need to consider a masking agent or a more suitable pH range.
- Reaction duration of your complexation reaction might be long. In this case, a back-titration or titration at elevated temperatures might be a better option.
- Make sure that you maintain a stable pH during your titration. This can be achieved by addition of an adequate buffer solution.
- Switching from manual to automated titration will increase accuracy and prevent common systematic errors. When using an optical sensor, make sure that you choose the right wavelength for the detection of the endpoint.