Recognition of endpoints (EP)
Apr 12, 2021
Article
 Share via email
Like many of you, I gained my first practical titration experience during my chemistry studies in school. At this time, I learned how to perform a manual visual endpoint titration – and I can still remember exactly how I felt about it.
Using a manual buret filled with titrant, I added each drop individually to an Erlenmeyer flask that contained the sample solution (including the analyte to be measured) and the indicator which was added prior to the titration. With each drop and even slight color change of my sample solution, minutes passed with increasing uncertainty. I asked myself, «Have I already reached the true endpoint, should I add another drop, or have I even over-titrated?» You have probably been in the same situation yourself!
Sound familiar to you? Don’t forget to check out our related blog post:
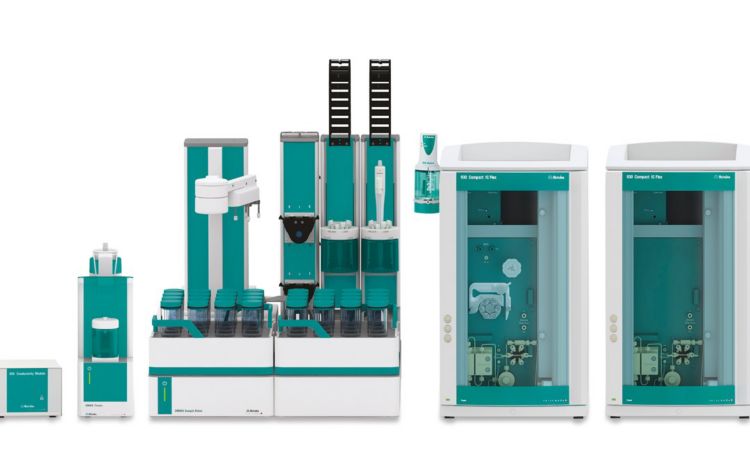
Several years have passed since then, and I am glad that I no longer have to face the challenges of performing a manual titration because Metrohm offers the possibility of automated titrations.
If you want to know how to determine the endpoint in an automated titration, I will give you all the answers you need. In the following article I will cover these topics (click to go directly to each):
Different detection principles – an overview
At this point you may ask yourself—if not visually, how the endpoint (EP) can be detected in an automated titration? Well, aside from the visual endpoint recognition (e.g., by a color change, the appearance of turbidity, or appearance of a precipitate), a titration EP can also be detected by the automated monitoring of a change in a chemical or physical property which occurs when the reaction is complete.
As shown in the table below, there are many different detection principles:
Table 1. Determination principles for various EP detection methods.
| Determination Principle | Description | |
|---|---|---|
Electrochemical EP | Potentiometric | The concentration-dependent potential (mV) of a solution is measured against a reference potential. |
Voltammetric | The concentration-dependent potential (mV) of a solution is measured at a constant electric current i.e., the polarization current Ipol applied to the polarizable electrode. | |
Amperometric | This indication technique allows measurement of the concentration-dependent current (μA) of a sample solution at a constant voltage. | |
Photometric EP | The basis of photometric indication is the change in intensity at a particular wavelength of a light beam passing through a solution. | |
| Conductometric EP | Conductometric indication measures the changes of electric conductivity during the titration. | |
Thermometric EP | Thermometric titrations record the changes in temperature. At completion, the reaction produces a molar heat of reaction ∆Hr which can be measured as a temperature change ∆T. | |
Now, let’s discuss the potentiometric and photometric EP determination in comparison to a visually recognized EP detection as they are the most commonly used determination principles for automated titrations. If you’d like to learn more about the principles of thermometric titration or conductometric titration, read our blog posts about the basics!
Potentiometric principle
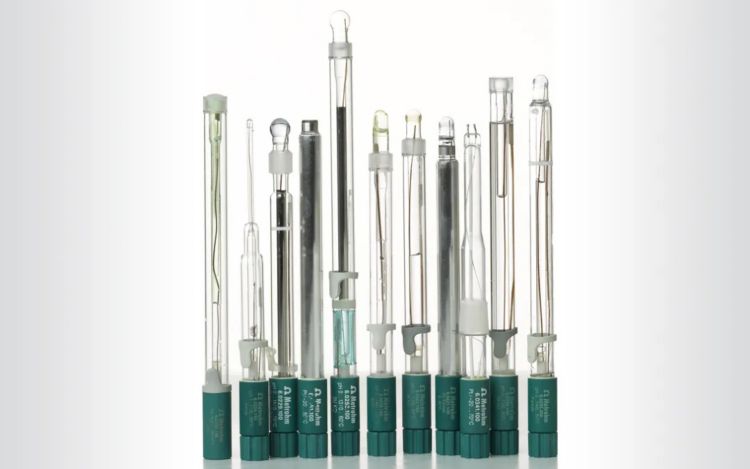
As shown in the table above, in the potentiometric principle the concentration dependent potential (mV) of a solution is measured against a reference potential. Therefore, a silver-silver chloride (Ag/AgCl) reference electrode is used in combination with a measuring electrode (pH sensitive glass membrane or metal ring). In general, a combined sensor (electrode) including both measuring and reference electrode is used.
 and automatically (right).")
Figure 1 illustrates with a simple example how a manual titration with a color change looks when being converted to an automatic system.
Step 1: Beginning of the titration before titrant is added.
Step 2: Addition of titrant – as the titration approaches the endpoint you begin to see signs of the color change. At this point in an automatic titration the sensor will detect a change in mV signal and the titrator begins dosing the titrant in smaller volumes and at a slower rate.
Step 3: Finally, the EP is reached with a faint pink color which corresponds with the inflection point in the titration curve.
Step 4: Titrating beyond the endpoint leads to over titration, and here the mV signal is fairly constant.

This is how you achieve the characteristic S-shaped titration curve you see when performing an automated titration.
Not only acid-base titrations can be converted. Figure 2 shows how a simple chloride titration can be converted. The titrant, titrant concentration, sample size, and sample preparation remain the same.
Only the indicator is replaced by the Ag Titrode, a silver ring electrode, and we get a titration curve (Figure 2, right side) with a clearly defined endpoint.
For more examples of possible potentiometric titrations, download our free monograph below or check out our Application Finder where you can find several examples for all endpoint recognition principles.

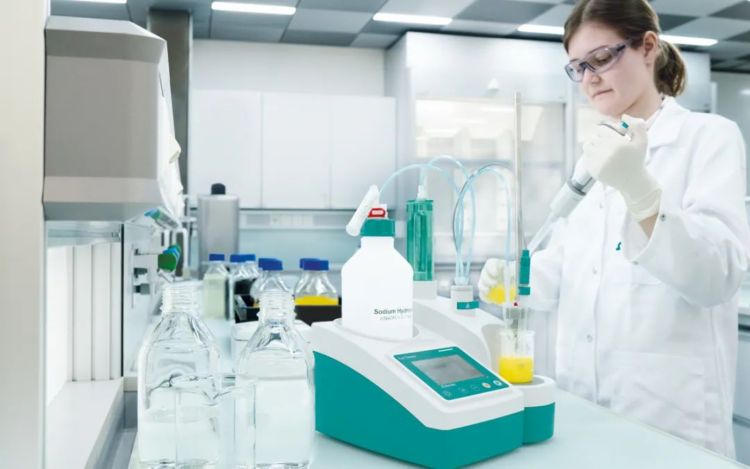
Titrations using color indicators are still widely used e.g., in pharmacopeias. When performed manually, the results depend, quite literally, on the eye of the beholder. Photometric titration using the Optrode makes it possible to replace this subjective determination of the equivalence point with an objective process that is completely independent of the human eye.
The advantage here is that the chemistry does not change – that is, the standard operating procedure (SOP) generally does not have to be adapted.
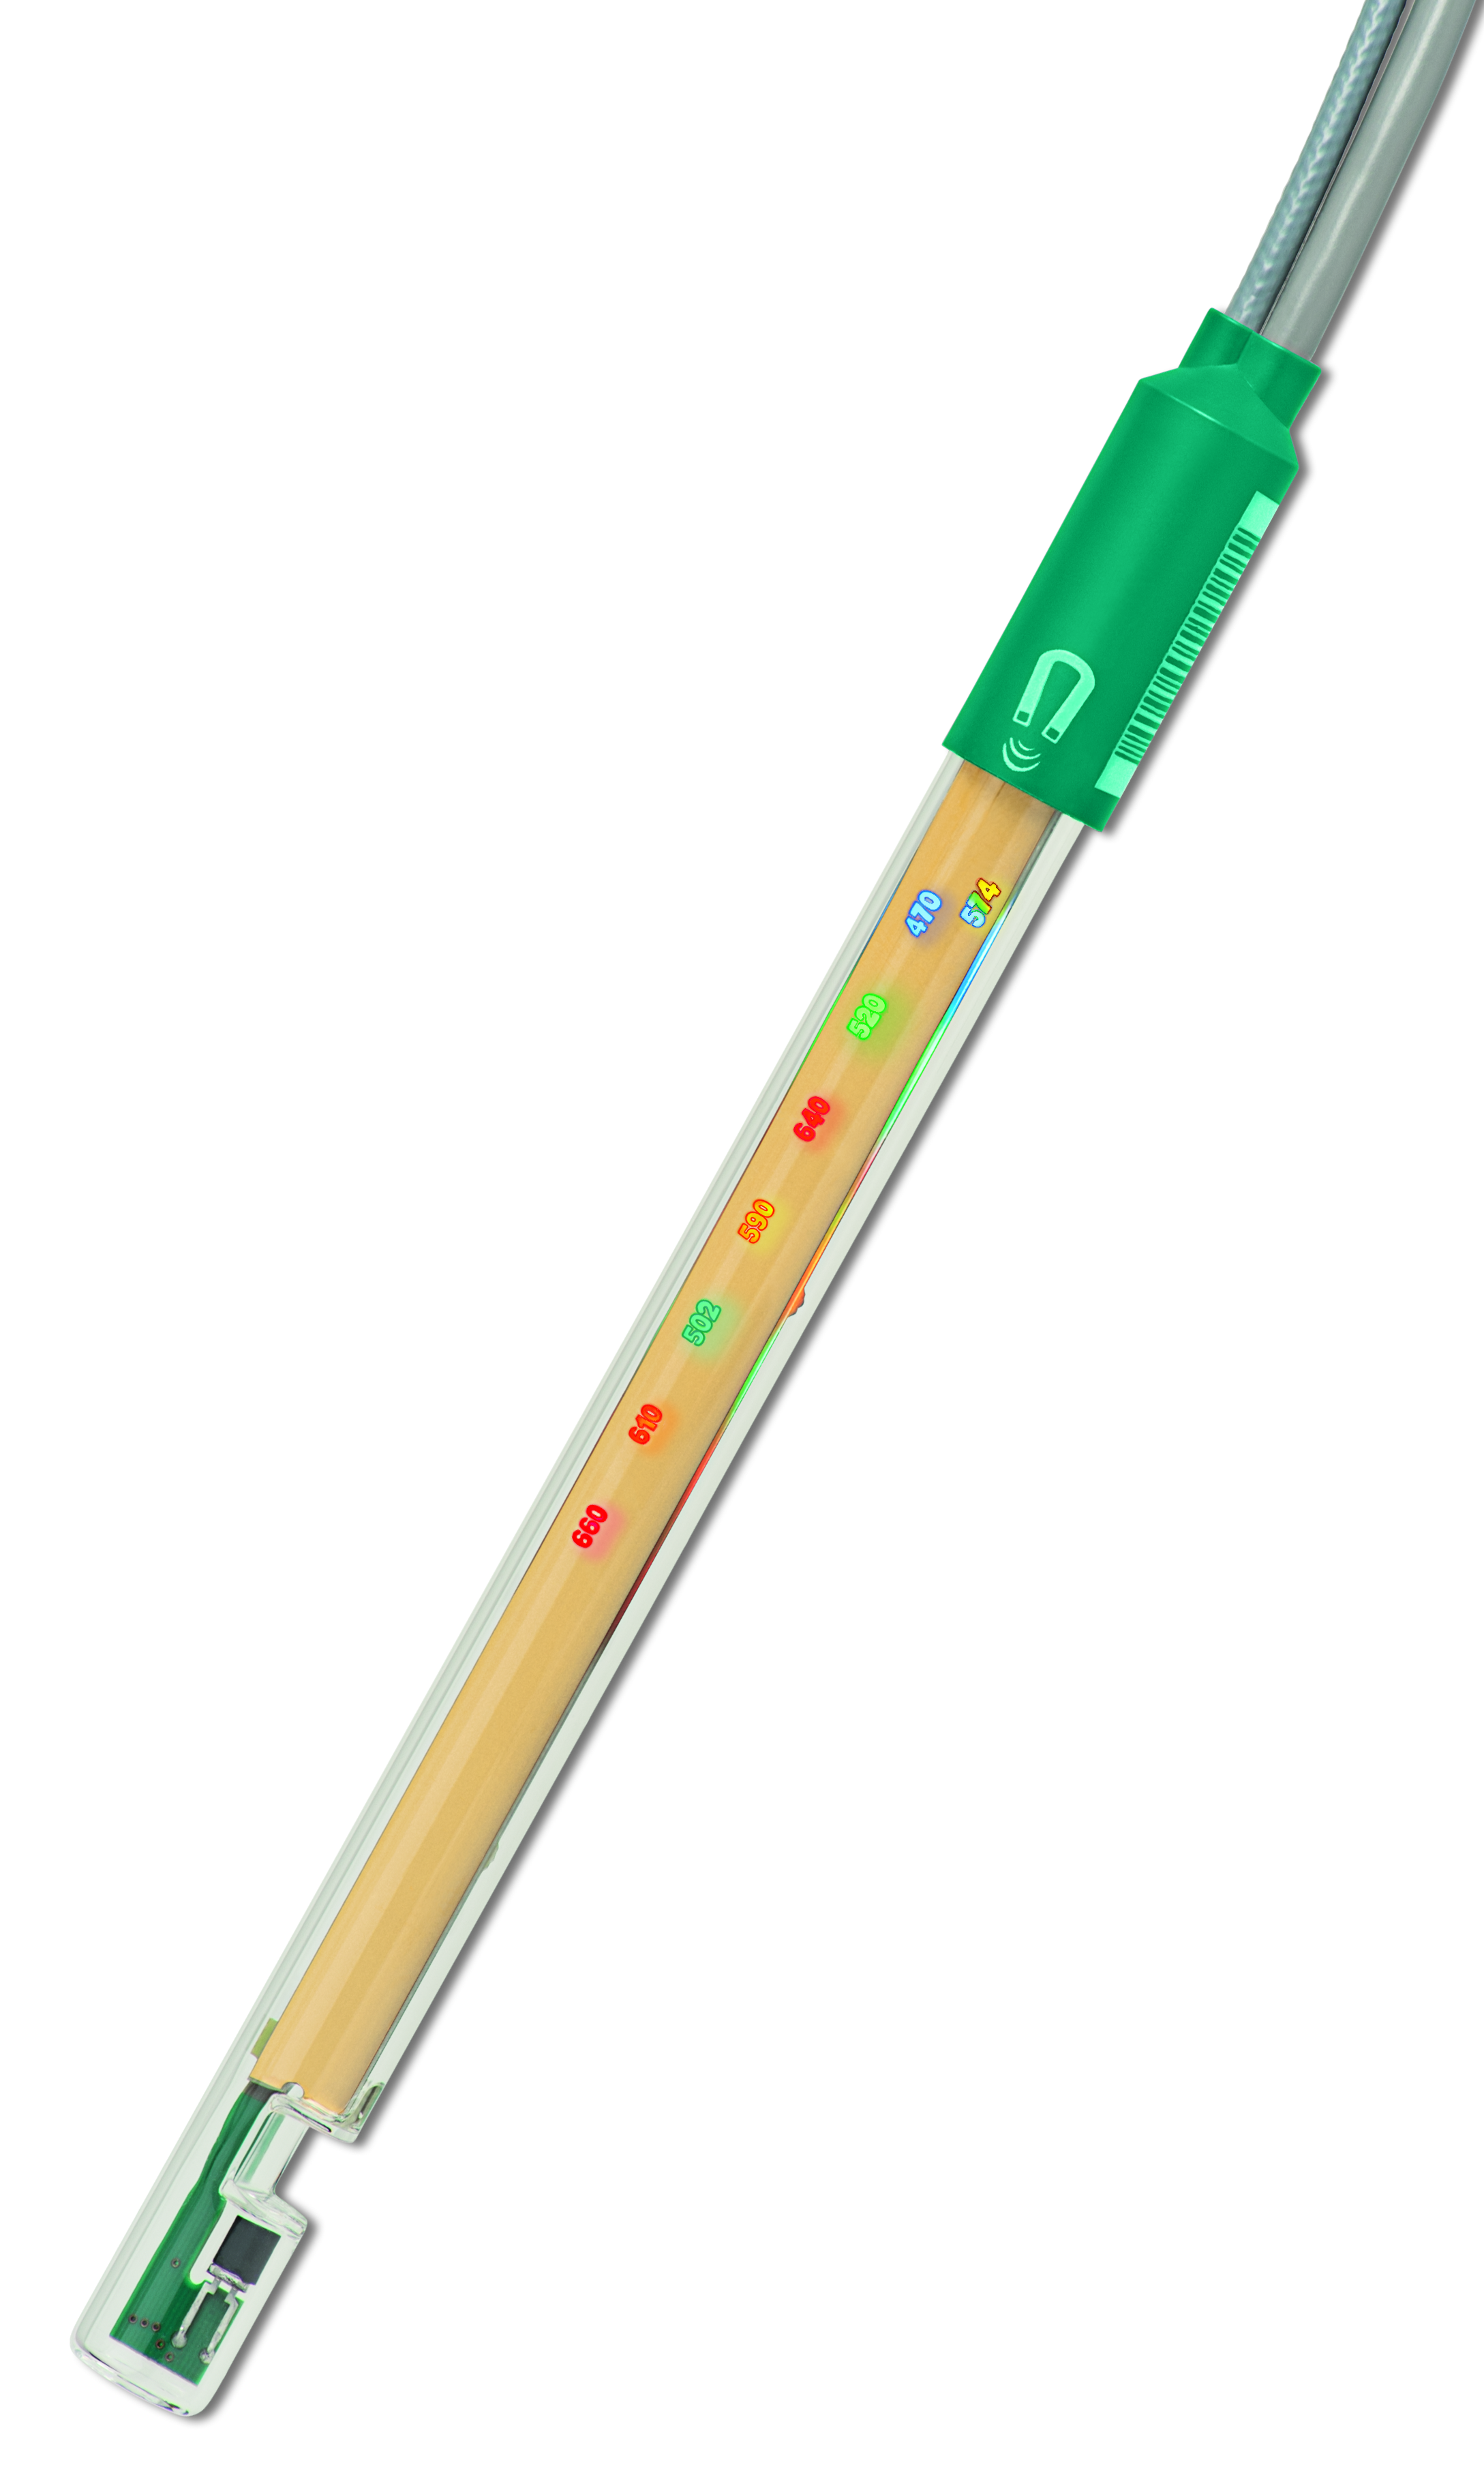
The basis of photometric indication is the change in intensity at a particular wavelength of a light beam passing through a solution. The transmission is the primary measured variable in photometry, and is given by the light transmission (mV or % transmission) of a colored or turbid solution that is measured with a photometric sensor such as the Optrode from Metrohm.
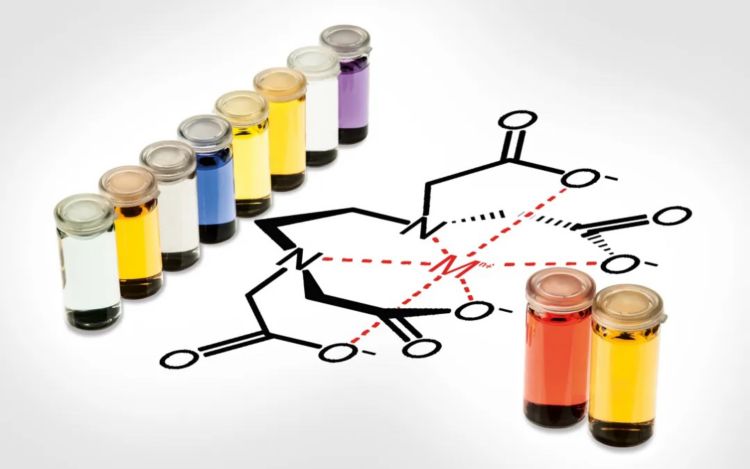
There are eight possible wavelengths to choose from that span nearly all color indicators used for titrations (Table 2). The shaft is solvent resistant and there is no maintenance required. It connects directly to the titrator and improves accuracy and repeatability of color indicated titrations.
| Wavelength | Color change to: | Usable range |
|---|---|---|
| 470 nm | Yellow | 460–480 nm |
| 502 nm | Orange / Red | 485–520 nm |
| 520 nm | Red | 505–535 nm |
| 574 nm | Violet / Purple | 560–585 nm |
| 590 nm | Blue | 575–605 nm |
| 610 nm | Blue / Green | 595–625 nm |
| 640 nm | Green | 620–655 nm |
| 660 nm | Black / Turbid | 650–670 nm |
I’ve also picked an example to show you how to convert an EDTA titration of manganese sulfate from manual titration to automated titration. Like in the example above, the procedure remains the same.
Photometric EDTA titration of manganese sulfate according to Ph. Eur. and USP
Are you ready to take the leap and switch to using an automated titration system? Read our other blog post to learn more.
How to Transfer Manual Titration to Autotitration

One advantage of automated titration is that a lower volume of chemicals is needed, resulting in less waste. With the same indicator Eriochrome Black TS, the Optrode is used at a wavelength of 610 nm. The titration curve (Figure 3, right side) shows a large potential change of the mV signal indicating a clearly defined titration endpoint.
If you are not sure what the optimal wavelength for your titration is, then have a look at our related blog post to learn more!
Comparison: Optrode vs. potentiometric electrodes
When you decide to make the switch to automated titration, there are some points to consider when comparing the Optrode with other Metrohm potentiometric electrodes. The following table lists the main criteria.
Table 3. Comparison of photometric and potentiometric measurement techniques for a selection of factors.
| Factor | Potentiometric with electrode | Photometric with Optrode |
|---|---|---|
| SOP changes | May have to update SOP to include use of electrode | Still uses same indicator and color-changing endpoint parameters |
| Color indicator | Not required; save on chemical preparation and additional analysis steps | Required |
| Turbid or colored samples | Ignores color and turbidity | Very turbid and colored samples can interfere |
| Sensor maintenance | Rinse, refill electrolyte, store properly | Rinse, store dry |
| Solvent resistance | Some solvent-resistant probes, need to consider chemical compatibility | Sealed, all-glass body for high chemical resistance |
| Replacement schedule | 6 months – 1 year | Upon breakage or light source exhaustion1 |
1Optrode has a working life of tens of thousands of hours.
Summary
You see, an autotitration is quite simple to perform and has the great advantage that a clearly defined endpoint is given.
Believe me, whenever I'm working with such a device including a suitable electrode for an automatic titration, I have a big smile on my face thinking back to my university days: Bye bye subjectivity, time-consuming procedure, economic inefficiency and non-traceability!
Maybe you are now also convinced to make the change in your laboratory.