You have been redirected to your local version of the requested page

Polypropylene and polyethylene: A brief introduction

Did you know that polypropylene (PP) and polyethylene (PE) are the most produced plastics in the world? Products made out of PP and PE are so ubiquitous that every single one of us encounters them several times per day. In this article you will learn how NIR spectroscopy can improve the efficiency of your PP and PE analysis along different steps along the production cycle. But first, let’s get a little bit of background information about PP and PE.

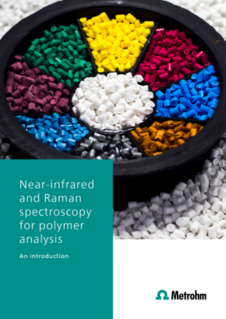
Polypropylene (also known as polypropene or PP) has a chemical formula of (C3H6)n. It is a thermoplastic polymer mainly produced from propylene monomers. PP is a versatile plastic commodity that also functions as a fiber. In 1954, it was first polymerized simultaneously by the Italian chemist, professor, and Nobel laureate Giulio Natta and Karl Rehn, a German chemist.

Polypropylene has the unique ability that it can be manufactured via several different methods and be utilized in many applications like packaging, injection molding, and fibers. This plastic commodity is the second most popular in the world, only preceded by polythene.

Polyethylene (or polythene, PE) is also a polymer, but it is made from ethylene monomers and has the chemical formula (C2H4)n. The first synthesis of PE in 1898 by the German scientist Hans von Pechmann was accidental. Similar to PP, PE is also a thermoplastic.

PE is the most used plastic worldwide. Polythene is very stable and is a good electrical insulator. It has a very low melting point and is used in large amounts for the automotive and food packaging industries. Approximately 70% of PE is utilized in food packages, food containers, pallets, and even in crates and bottles.
 

2021/05/25/nirs-qc-polymers-part-2/2
Figure 1. Molecular structures of PE and PP.

Polyethylene is available in many different types:

  • Ultra-High-Molecular-Weight Polyethylene (UHMWPE)
  • Ultra-Low-Molecular-Weight Polyethylene (ULMWPE or PE-WAX)
  • High-Molecular-Weight Polyethylene (HMWPE)
  • High-Density Polyethylene (HDPE)
  • High-Density Cross-Linked Polyethylene (HDXLPE)
  • Cross-Linked Polyethylene (PEX or XLPE)
  • Medium-Density Polyethylene (MDPE)
  • Linear Low-Density Polyethylene (LLDPE)
  • Low-Density Polyethylene (LDPE)
  • Very-Low-Density Polyethylene (VLDPE)
  • Chlorinated Polyethylene (CPE)

Differences between polypropylene and polyethylene

Which is better, polypropylene or polyethylene? It all depends on the application! For what purpose are they being used? Both polymers are considered «commodity plastics». These are plastics that are used in high volumes for a wide range of applications.

Let’s compare some of the properties of each.

Table 1. Comparison chart of polypropylene vs. polyethylene.
Polypropylene (PP) Polyethylene (PE)
Chemical Properties

Semi-crystalline

Polypropylene bag

Inert, translucent

Polyethylene bag

Electrical Properties

High static charge

Poor insulator

Low static charge

Good insulator

Melting Point
130–171 °C 115–135 °C
Chemical Formula
(C3H6)n (C2H4)n
Uses
Fibers, films, caps, hinges, synthetic paper Plastic bags, bottles, food containers, pallets, geomembranes, films made of plastic, crates, etc.
Density

0.855 g/cm3 amorphous

0.946 g/cm3 crystalline

0.88–0.96 g/cm3
Relative Cost
Low Medium

NIRS as a tool to assess the quality of PP and PE

For over 30 years, near-infrared spectroscopy (NIRS) has been an established method for fast and reliable quality control within the PP/PE industry. Despite this, many producers still do not consistently consider the implementation of NIRS in their QA/QC labs. Limited experience regarding application possibilities or a general hesitation about implementing new methods are some of the reasons behind this.

The advantages of using NIR spectroscopy for QA/QC are numerous. One major advantage of NIRS is the determination of multiple parameters in just 30 seconds with no sample preparation! The non-invasive light-matter interaction used by NIRS, influenced by physical as well as chemical sample properties, makes NIRS a suitable method for the determination of several critical quality parameters in these polymers and many more.

In the remainder of this article, a short overview on PE and PP applications are presented, followed by available turnkey solutions for PE and PP, developed according the NIRS implementations guidelines of ASTM E1655-17.

Applications and parameters for PE and PP with NIRS

During production of PE and PP it is important to check certain parameters to guarantee the quality. These parameters include the density to classify the PE type, copolymer level to enhance certain properties like strength and solvent resistance, and melt flow rate to make sure PP can be formed to the intended shape.

The most relevant applications for NIRS analysis of PE and PP are listed in Table 2.

Table 2. Available application notes for use of NIRS for PE and PP
Polymer Parameter Related NIRS Application Notes
Polyethylene (HDPE/LDPE)

Identification, Density, Melt Flow Index, Copolymer level

AN-NIR-083

AN-NIR-081

AN-NIR-034

AN-NIR-003

Polypropylene (PP)

Identification, Melt Flow Index, Additives

AN-NIR-083

AN-NIR-082

AN-NIR-034

AN-NIR-004

Where can NIRS be used in the production process of PE and PP?

2021/05/25/nirs-qc-polymers-part-2/5
Figure 2. Illustration of the polyethylene/polypropylene production chain.

Figure 2 shows the individual production steps from the plastic producer via plastic compounder and plastic converter to the plastic parts producer. The first step in which near-infrared lab instruments can be used is when the pure polymers like PE and PP are produced, and their purity needs to be confirmed. NIRS is also a very useful technique during the next step where polymers are compounded into intermediate products to be used for further processing.

Easy implementation of NIR spectroscopy for plastic producers

2021/05/25/nirs-qc-polymers-part-2/6
Figure 3. Turnkey solutions for PE and PP analysis with the Metrohm DS2500 Polymer Analyzer.

Metrohm has extensive expertise with analysis of PE and PP and offers a turnkey solution in the form of the DS2500 Polymer Analyzer. This instrument is a ready-to-use solution to determine multiple quality parameters in PE and PP.

Application example: Turnkey solution for the determination of Melt Flow Rate (MFR) of PP

The Melt Flow Rate of polypropylene pellets is an important parameter to measure so that PP can be formed in the intended shape. The model created with the chemometric software is based on a large collection of real product spectra and is developed in accordance with ASTM E1655 Standard practices for Infrared Multivariate Quantitative Analysis. For more detailed information on this topic, download the free White Paper.

White Paper: Near-Infrared Spectroscopy: Quantitative analysis according to ASTM E1655


To learn more about pre-calibrations for PP, download our brochure and visit our dedicated webpage.

Brochure: Quality control of polymers (PE, PP, PET, Polyamide) – Fast results with NIR pre-calibrations

Pre-calibration for polypropylene (PP)


The result of this turnkey solution for the non-destructive determination of Melt Flow Rate of PP without rheological tests is shown in Figure 4.

Figure 4. Turnkey solution for Melt Flow Rate of PP using the Metrohm DS2500 Polymer Analyzer. A: Sampling and analysis of PP pellets. B: Results of MFR from NIRS compared to a primary laboratory method along with the Figures of Merit (FOM) for this analysis.

This solution demonstrates the feasibility of NIR spectroscopy for the analysis of MFR in polypropylene samples. The standard procedure (ASTM D1238) requires a significant amount of work including packing the sample, preheating, and cleaning. With no sample preparation or chemicals needed, Vis-NIR spectroscopy allows the analysis of MFR in less than a minute.

Learn more about the procedure in our free Application Note.

Quality Control of Polypropylene – Non-destructive determination of melt flow rate without rheological tests

Other installments in this series

This article is a detailed overview of the use of NIR spectroscopy as the ideal QC tool for the analysis of polypropylene and polyethylene. Other installments in this series are dedicated to:

Overview of NIRS in polymer production

Polyethylene terephthalate (PET)

Polyamide (PA)

Polyols and Isocyanates to produce Polyurethane (PU)

Author
Guns

Wim Guns

International Sales Support Spectroscopy
Metrohm International Headquarters, Herisau, Switzerland

Contact