Spectroelectrochemistry is an experimental method that combines an electrochemical measurement coupled to an in-situ spectroscopical measurement. The spectroscopical measurement can be performed either in transmittance or in absorbance. The light is used to probe the immediate vicinity of the working electrode located in the cell. The spectroscopic measurement provides useful complementary information during an electrochemical measurement. It can be used to identify reaction intermediates or product structures, during an electrochemical measurement.

For this application note, the Autolab spectrophotometer was used (see Figure 1). This device is directly integrated in the NOVA software and can be controlled during an electrochemical measurement.
The spectrophotometer is controlled through a USB interface by NOVA. The spectrophotometer can acquire one spectrum in the specified range each time the Autolab sends a TTL pulse to the spectrophotometer, using a dedicated cable.
The measurements described in the application note are performed in transmission mode.
The spectrophotometer is connected to a cuvette holder using optical fibers. The cuvette holder is connected to an Autolab light source. This light source covers a range from 200 nm to 2500 nm. The light source can be connected to the Autolab using a dedicated cable, allowing the shutter of the light source to be operated remotely by using a TTL pulse.
The electrochemical cuvette is fitted with a Pt mesh working electrode and a Pt counter electrode. The reference electrode is a small Ag/AgCl 3 M KCl electrode that can be fitted in the lid of the cuvette. The optical path is 1 mm.
The cuvette is filled with a few mL of a 0.05 M potassium ferrocyanide (K4[Fe(CN)6]) solution. This solution is pale yellow in color. When the potassium ferrocyanide is oxidized in potassium ferricyanide (K3[Fe(CN)6]), the solution changes to orange. This electron transfer reaction can therefore be followed by visible light spectroscopy.

The measurement range of the spectrophotometer is defined in the software, see Figure 2.
The electrochemical measurements were performed using the linear sweep voltammetry. During the electrochemical measurement, a trigger is sent to the spectrophotometer every 10 points. For every 10 data points in the electrochemical measurement, one spectrum is acquired, using the settings defined in the software (see Figure 2).
At the beginning of the measurement, two additional measurements are taken in order to determine the dark spectrum (blue line in Figure 3) and the reference spectrum (red line in Figure 3).
 and reference spectrum (red line) recorded at the beginning of the measurement.")
A single dark and reference spectrum is recorded for the whole experiment. These spectra are recorded at the start potential of the linear sweep voltammetry measurement.
Figure 4 shows a typical linear sweep voltammetry recorded for the ferrocyanide/ferricyanide system.

At the end of the linear sweep voltammetry measurement, the spectroscopic data is recovered from the spectrophotometer and correlated to the electrochemical data. The measured intensity is converted into absorbance A, using the following Equation:
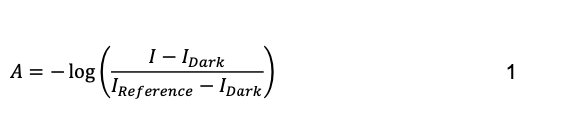
Where 𝐼 (𝑎. 𝑢. ) is the measured intensity, 𝐼Dark (𝑎. 𝑢. ) is the measured dark intensity and 𝐼Reference (𝑎. 𝑢. ) is the measured reference intensity.
Figure 5 shows an overlay of spectra recorded during the positive going potential scan. The spectra show an increase in absorbance at 425 nm, corresponding to the formation of the oxidized form of ferrocyanide.

The increase in absorbance at 425 nm is consistent with the yellow shift observed during the oxidation of the Fe(II) to Fe(III) complex.
The Autolab NOVA software provides direct integration of Autolab spectrophotometers and light sources. Combined with a suitable electrochemical cuvette, the combination of these instruments together with any Autolab potentiostat/galvanostat provides the means to perform any spectroelectrochemical measurement from one convenient software.
The spectroscopic data obtained during the measurement can be directly correlated to the electrochemical data, thus providing the means to create 3D plots combining the spectroscopic data with the electrochemical data.
 Share via email
 Download PDF