A novel UV-Vis spectroelectrochemical cell for conventional electrodes is described in this Application Note. The new device is designed to focus the light on the working electrode surface in order to obtain the spectroscopic information associated with the electrochemical processes that take place during the experiment.
The material selected for the fabrication of the reflection cell facilitates accurate spectroelectrochemical measurements in both aqueous solutions and organic solvents. In order to demonstrate the excellent performance of the UV-Vis spectroelectrochemical cell, a study of two different electrochemical systems was performed. The results of the study are discussed in this Application Note.
Measurements shown in this study were performed using the spectroelectrochemical UV-Vis cell for conventional electrodes (REFLECELL-C) from Metrohm DropSens. This novel black cell with an easy open-close magnet system consists of two PEEK pieces (Figure 1). The top one contains a central hole for introducing the optical probe, whose position with respect to the working electrode (WE) is optimized thanks to a clamping piece. Furthermore, it has four openings for counter (CE) and reference (RE) electrodes and air flux, but these spaces can be closed with caps.
 and completely assembled cell with WE, CE, RE, and optical fiber held with clamping piece for optimal positioning (R).")
The upper section of the bottom piece has a compartment for adding 3 mL of sample solution (Figure 2). The underside of the bottom piece has a small recess for placing an O-ring which prevents the leakage of solution. The working electrode is fixed in place using a clamping piece. Finally, a holder is used to stabilize the entire cell and facilitate the performance of the measurements.
The complete setup includes the REFLECELL-C in combination with a SPELEC instrument (SPELEC) and a UV-Vis reflection probe (RPROBE-VIS-UV) (Figure 1). Platinum (6.09395.024), steel (6.0343.110), and Ag/AgCl (6.0728.120) Metrohm electrodes were used as WE, CE, and RE, respectively.
SPELEC is controlled with DropView SPELEC software. DropView SPELEC is a dedicated software that provides spectroelectrochemical information and includes a variety of tools to perform the treatment and analysis of the collected data.

Spectroelectrochemical experiments in this study were performed in aqueous solutions as well as in organic solvents. The ferrocyanide/ferricyanide redox couple (a quasi-reversible system widely used in spectroelectrochemistry) was selected to validate the described cell. The two redox forms are spectroscopically distinguishable: ferricyanide exhibits two absorption bands at 310 and 420 nm, while ferrocyanide does not exhibit any bands.
For the tests involving aqueous media, the spectroelectrochemical measurements were carried out in a solution of 0.1 mol/L KNO3 containing 10 mmol/L ferrocyanide. Cyclic voltammetry was performed by scanning the potential from -0.20 V to +0.60 V and back to -0.20 V, with a scan rate of 0.05 V/s. Optical information was recorded using an integration time of 10 ms (scans to average: 2). Figure 3a shows that the expected peaks are observed; ferrocyanide is oxidized to ferricyanide during the forward scan (+0.27 V), while the reduction of the ferricyanide (which was previously generated) to ferrocyanide is detected in the backward scan (+0.15 V). Although more than 1500 spectra were recorded during the entire experiment, a selection of six are shown in Figure 3b to better visualize the optical results. The absorption band at 420 nm is well defined in the example.
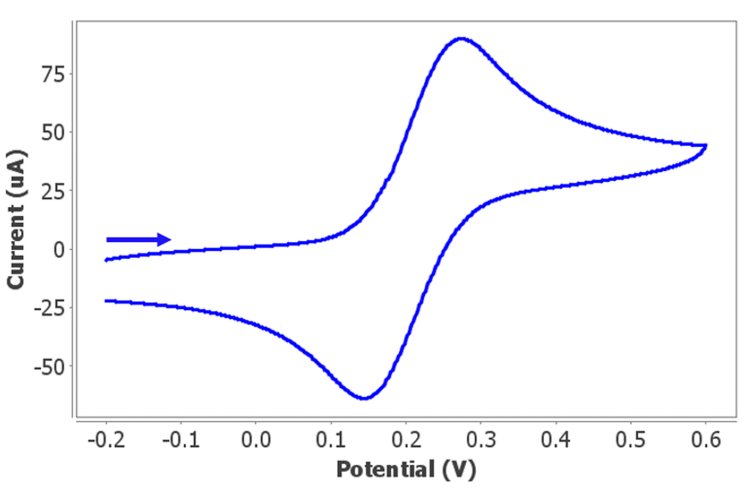
 Cyclic voltammogram and (b) UV-Vis spectra recorded in an aqueous solution of 10 mmol/L ferrocyanide and 0.1 mol/L potassium nitrate. The potential was scanned from -0.20 V to +0.60 V and back to -0.20 V at 0.05 V/s. Integration time was 10 ms.")
In order to understand the spectroelectrochemical behavior, the evolution of the band at 420 nm with potential was directly calculated by DropView SPELEC software and is displayed in red in Figure 4a. At the beginning of the experiment from -0.20 V to +0.12 V, no bands are detected. However, when the oxidation of ferrocyanide starts (EC signal, blue line), the absorption at 420 nm increases during the forward scan but also in the backward sweep up to +0.26 V when the reduction of ferrocyanide begins. Finally, the absorption decreases at a potential lower than +0.26 V during the reduction of ferricyanide in the cathodic scan.
Furthermore, in Figure 4b the green line displays the relevant derivative voltabsorptogram (dAbs/dt vs. potential) at 420 nm. This derivative curve almost perfectly matches the cyclic voltammogram (shown in blue), demonstrating that the spectroscopic changes are only related to the faradaic processes—in this case, the interconversion between ferro- and ferricyanide.
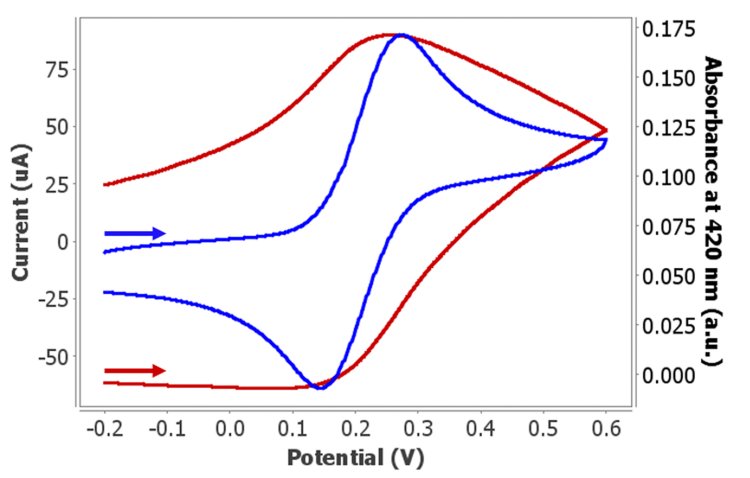
 Evolution of absorption and (b) the derivative voltabsorptogram at 420 nm with changing potential.")
The spectroelectrochemical cell was also tested in organic solvents. As a proof of concept, acetonitrile was selected as the solvent. A UV-Vis spectroelectrochemical experiment was performed with a solution of 1 mmol/L ferrocene and 0.1 mol/L TBA (tetrabutylammonium hexafluorophosphate) in acetonitrile. Using cyclic voltammetry, the potential was scanned from +0.10 V to +0.70 V and back to +0.10 V with a scan rate of 0.05 V/s. Figure 5a shows the electrochemical oxidation of ferrocene to the ferrocenium ion at +0.46 V in the forward scan, and its reversible reduction at +0.37 V in the backward sweep.
The spectra shown in Figure 5b were recorded using an integration time of 5 ms (scans to average: 4). The characteristic two absorption bands at 275 and 610 nm associated with the ferrocenium ion are clearly observed.
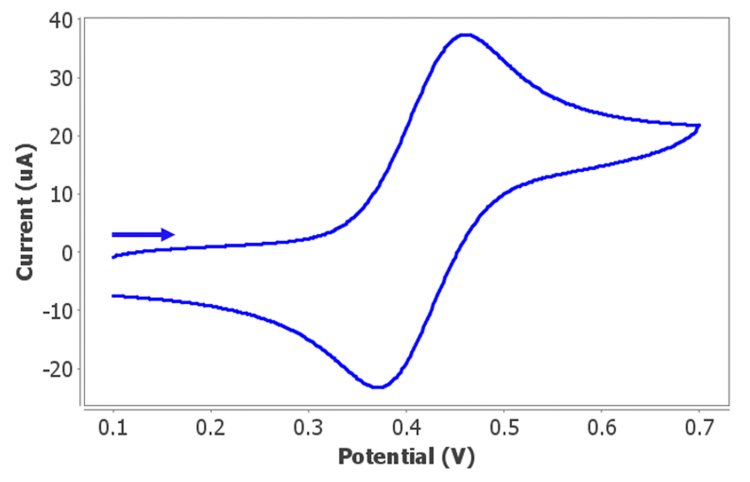
 Cyclic voltammogram and (b) UV-Vis spectra recorded in a solution of 1 mmol/L ferrocene and 0.1 mol/L TBA in acetonitrile. The potential was scanned from +0.10 V to +0.70 V and back to +0.10 V. Integration time was 5 ms.")
Evolution of the band at 275 nm with potential (red line in Figure 6a) shows that the absorbance increases from +0.32 V when the oxidation of ferrocene takes place (blue line). The absorption value increases during the anodic scan as well as in the first segment of the cathodic scan. At potentials lower than +0.47 V, the absorbance decreases due to the reduction of ferrocenium ion to ferrocene. The same analysis was performed with the band at 610 nm, and the same spectroelectrochemical behavior was observed. It can be concluded that both bands are related to the ferrocenium ion generated during the oxidation of ferrocene.
In addition, the derivative voltabsorptogram (dAbs/dt vs. potential) at 610 nm was directly obtained in the DropView SPELEC software (green line in Figure 6b). The signal very closely matches the cyclic voltammogram (blue line). This demonstrates that the optical changes are only related to the electrochemical oxidation and reduction of ferrocene/ferrocenium couple.
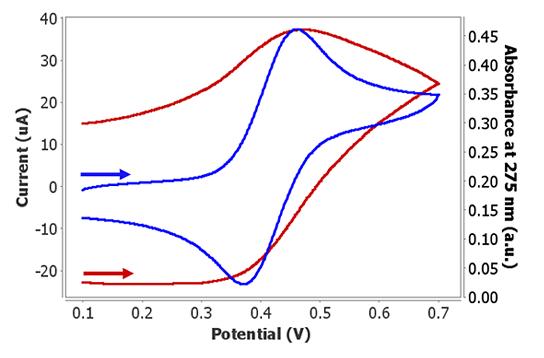
 Evolution of absorption and (b) a derivative voltabsorptogram at 275 nm with potential.")
The development of a novel reflection cell for conventional electrodes facilitates the performance of spectroelectrochemical measurements. This device allows researchers to work in aqueous solutions as well as in organic media due to its chemical resistance. This important property is useful not only to perform spectroelectrochemical experiments in the UV-Vis region, but also in the near-infrared (NIR) region since the traditional aqueous limitation is overcome.
As a proof of concept, the spectroelectrochemical cell has been validated in this study by monitoring the electrochemical behavior of a ferrocyanide aqueous solution and ferrocene in an acetonitrile solvent. Excellent results are obtained with both experiments, demonstrating the usefulness of the cell in different media.
AN-SEC-001 - Spectroelectrochemistry: an autovalidated analytical technique – Confirm results via two different routes in a single experiment
AN-SEC-002 - Gathering information from spectroelectrochemical experiments – Calculation of electrochemical parameters from data
AN-RA-004 UV-Vis spectroelectrochemical monitoring of 4-nitrophenol degradation
Spectroelectrochemical Instrument – SPELEC Instrument (DS.1.773.5021)
Spectroelectrochemistry within everyone’s reach – When combining two techniques became the perfect solution for your research (8.000.5323)
 Share via email
 Download PDF